Estato — listings collection and market analytics for a real estate agency
An estate agent’s work starts with one question: is this property worth its price or not. The answer is usually put together by hand — open five listing sites, find similar flats, do the maths in your head. We built a system that does this continuously: it watches the sources, brings the listings to one format and compares a specific property with the market in its area.
How it looks inside
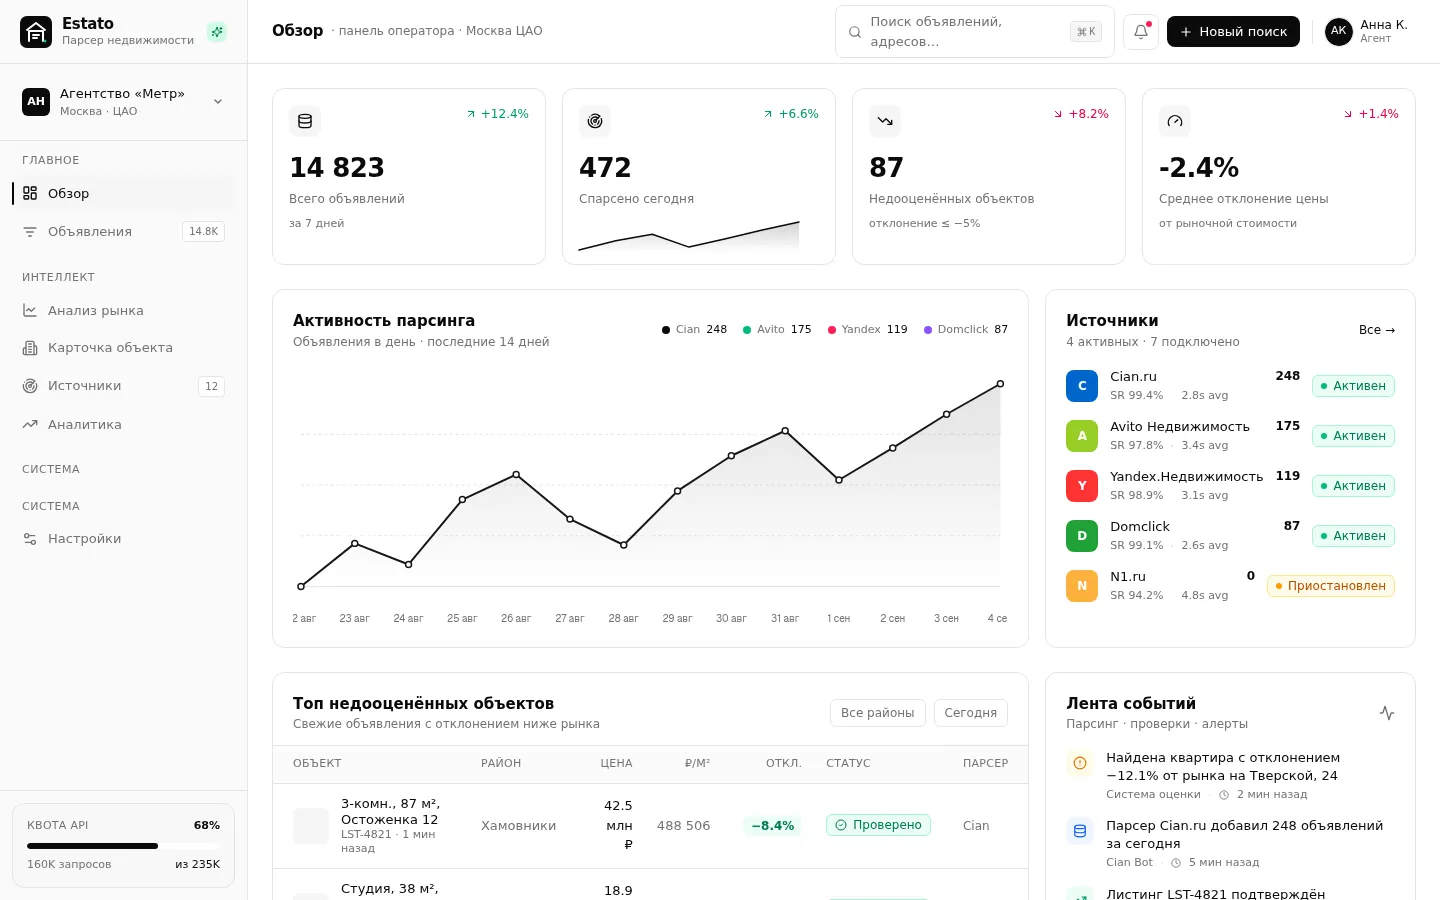
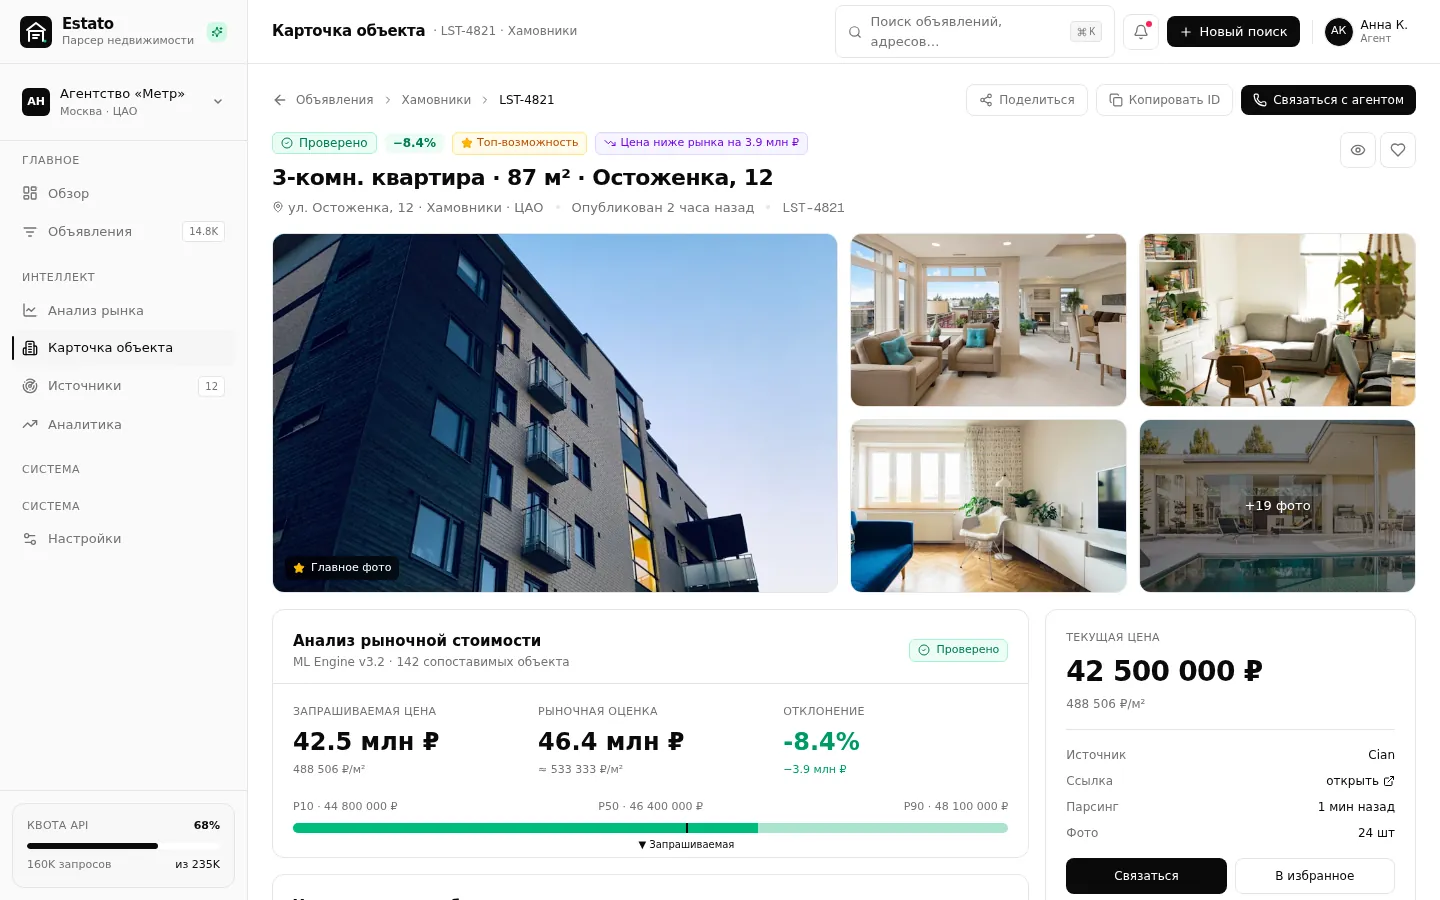
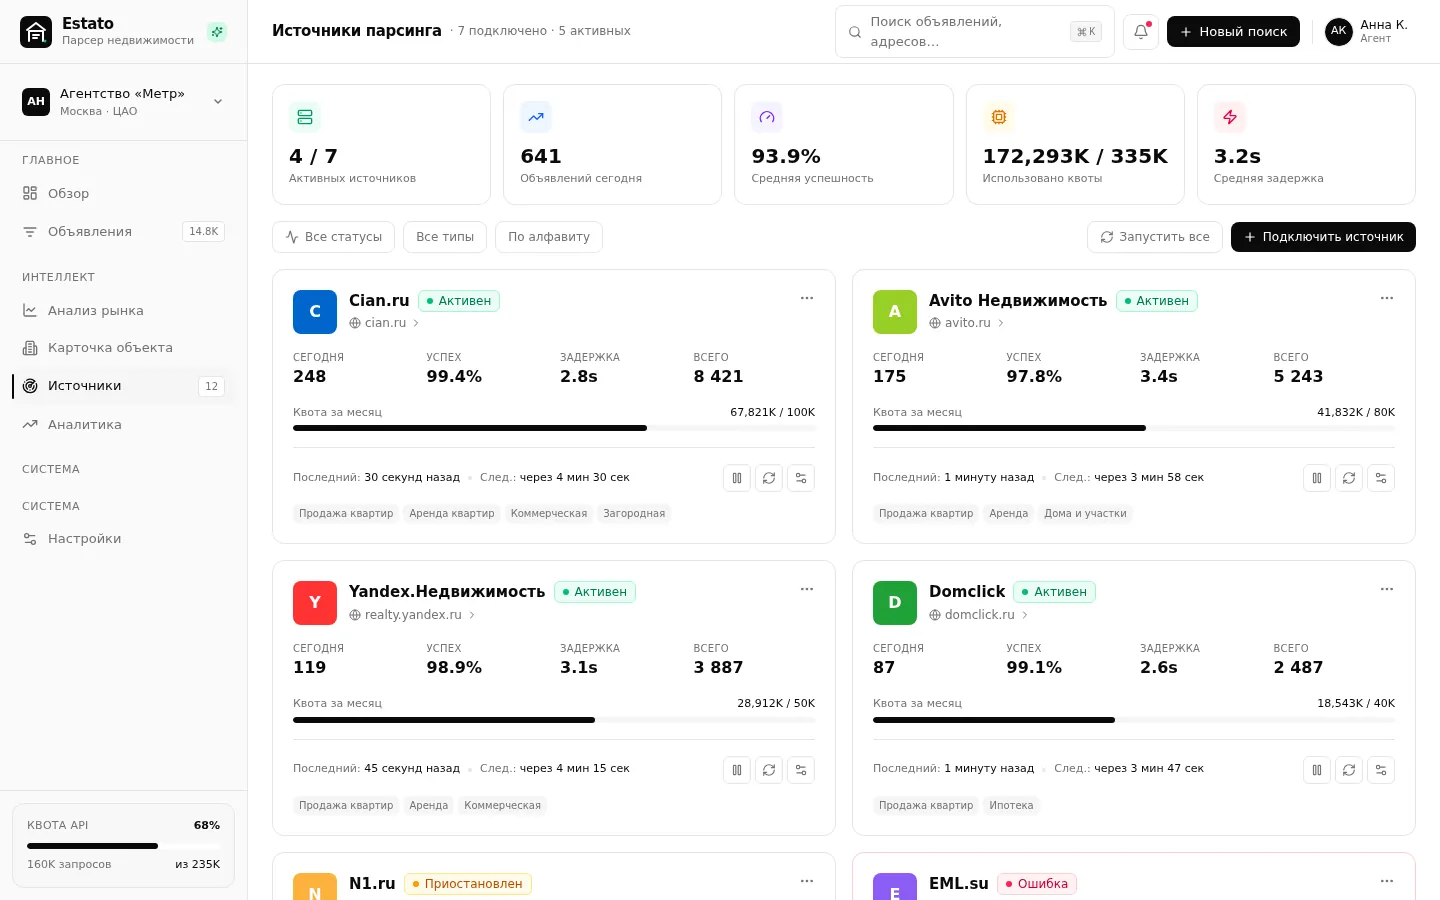
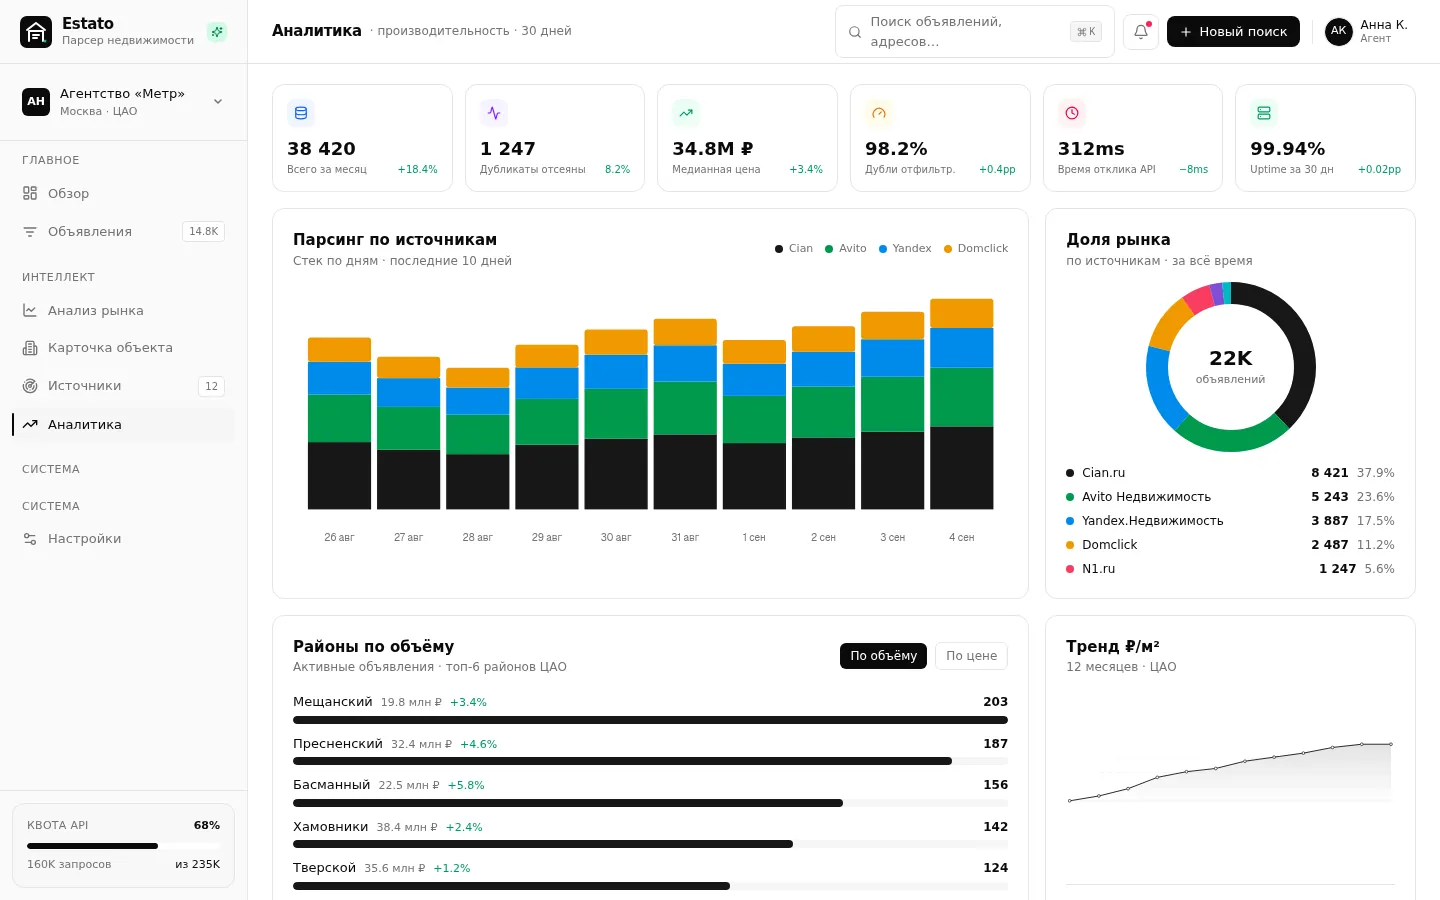
The interface is shown with demo data: we do not publish real cases, calls or client records.


What the product does
- One feed of listings from all connected sources, without duplicates
- A property record with the price history and a list of comparable offers
- A valuation of the deviation from the market, with an explanation of how it was arrived at
- Market analysis by area: the price per square metre over time, the volume of supply, time on the market
- The structure of the market by property type — flats, studios, commercial, out-of-town
- A list of the areas with the most potential — where to look first
- The state of the sources: what responds, what has broken, how much quota is left
- Export to CSV for those who trust their own spreadsheet anyway
A complex system under the hood
Behind every line in the feed there is a chain of work: polling the source, parsing the page, normalising the fields, geocoding, merging duplicates, recalculating the valuation for the area and checking that the source is still responding at all. There are a dozen sources, and each has its own structure, its own field names, its own update logic and its own pace at which all of this changes without warning.
That is why collection is separated from meaning in the system. A source’s scraper is responsible only for getting the raw data out, and after that the data is normalised into a common schema: property type, area, floor, condition, coordinates, the price and its history. If one source breaks, the others keep working, and the panel shows exactly which one and when.
Duplicates and price history
One flat on three sites, with two agents, with different photos and different prices — that is normal for the market.
The system merges such listings into one record based on a combination of signs: address and coordinates, area and floor, layout, the set of photos. The record shows the price history: when the property appeared, how many times it got cheaper and by how much.
A valuation you can challenge
Next to the valuation the system always shows its basis: which comparable properties it was calculated from, over what period, and how exactly this property differs from them. The agent sees the whole calculation and can dispute it at their own discretion.
How it is built
- 1 Collection Sources are polled on a schedule, within their limits and without extra load on the sites
- 2 Normalisation Different formats are brought to one schema: type, area, floor, condition, coordinates
- 3 Deduplication The same property from different sites is merged into one record with a price history
- 4 Valuation The model calculates a fair price from comparable properties in the area and period
- 5 Signal Properties that deviate noticeably from the market go into a separate list, with the reasoning
What it is built with
Need something similar?
Tell us what is happening on your side now. Scoping and the estimate are free and commit you to nothing.